Observing Marcus Inverted Region
Overview
In this notebook we will simulate the charge transfer between two molecules using the Marcus model
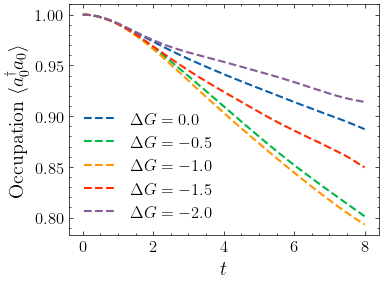
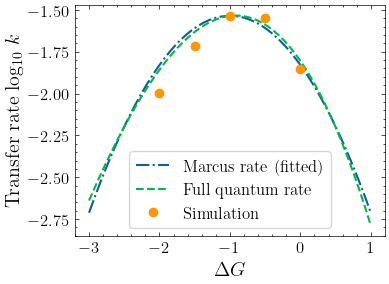
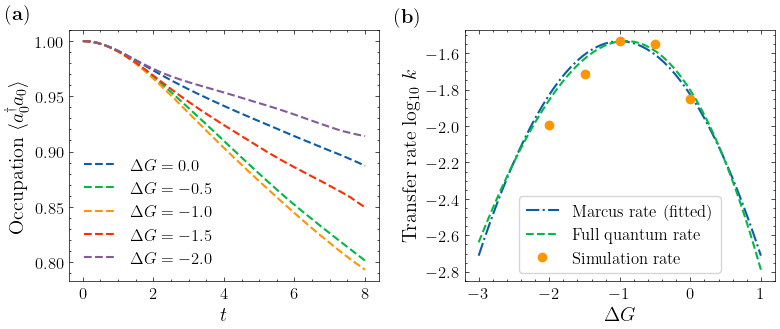
with transfer integral \(V=-0.1\), dimensionless coupling constant \(g=1\), vibration frequency \(\omega=0.5\). We will show that, by decreasing the reaction Gibbs free energy change \(\Delta G\), the reaction rate will first increase and then decrease, as predicted by the Marcus theory.
Define the Hamiltonian and initial state
[1]:
import numpy as np

from tencirchem import Op, BasisMultiElectron, BasisSHO, TimeEvolution, set_backend

set_backend("jax")
[1]:
jax_backend
[2]:
v = -0.1
g = 1
omega = 0.5
nbas = 8
[3]:
def get_hamiltonian(delta_g):
    ham_terms = v * Op(r"a^\dagger a", ["e0", "e1"]) + v * Op(r"a^\dagger a", ["e1", "e0"])
    ham_terms += delta_g * Op(r"a^\dagger a", "e1")
    for i in range(2):
        ham_terms += omega * Op(r"b^\dagger b", f"v{i}")
        ham_terms += g * omega * Op(r"a^\dagger a", f"e{i}") * Op(r"b^\dagger+b", f"v{i}")
    basis = [BasisMultiElectron(["e0", "e1"], [0, 0]), BasisSHO("v0", omega, nbas), BasisSHO("v1", omega, nbas)]
    return ham_terms, basis
[4]:
# using a relaxed initial state
def get_init_condition():
    basis = BasisSHO(0, omega, nbas)
    state = np.linalg.eigh(basis.op_mat(r"b^\dagger b") + g * basis.op_mat(r"b^\dagger+b"))[1][:, 0]
    return {"v0": state}
Run simulation
Next, we run the simulation using the TimeEvolution class with the custom initial state. The execution may take 10-20 minutes since it’s a 7-qubit system and 5 trajectories are generated.
[5]:
n_list = []
delta_g_list = np.linspace(0, -2, 5)
for delta_g in delta_g_list:
    ham_terms, basis = get_hamiltonian(delta_g)
    init_condition = get_init_condition()
    te = TimeEvolution(ham_terms, basis, init_condition=init_condition, property_op_dict={"n": Op("a^\dagger a", "e0")})
    for i in range(40):
        te.kernel(0.2)
    n_list.append(te.property_dict["n"].real)
Analyze and plot
[6]:
from matplotlib import pyplot as plt
import mpl_config
[7]:
t = np.arange(41) * 0.2
for i, n in enumerate(n_list):
    label = r"$\Delta G =" + str(delta_g_list[i]) + "$"
    plt.plot(t, n.real[:, 0], label=label, linestyle="--")
plt.xlabel("$t$")
plt.ylabel(r"Occupation $\langle a^\dagger_0 a_0 \rangle$")
plt.legend()
[7]:
<matplotlib.legend.Legend at 0x7fe1baea3690>

The Marcus rate is
where \(\lambda = 2g^2\omega\) is the reorganization energy. Since temperature is not considered in this simulation, \(\beta\) need to be fitted.
[8]:
# fit charge transfer rate
rate = [-np.polyfit(t[10:], n[:, 0][10:], 1)[0] for n in n_list]
rate
[8]:
[0.014047289363197032,
 0.02814188436474036,
 0.029197240764329252,
 0.019342655847204578,
 0.01011515881320177]
Next, compare the simulated rate with the Marcus rate and the nuclear tunneling charge transfer rate (Phys. Rev. B 2009, 79, 115203)
[9]:
from matplotlib import pyplot as plt
import mpl_config
import numpy as np

delta_g_list = np.linspace(0, -2, 5)
rate = [0.014048168006004535, 0.028141822635725088, 0.02919731407299346, 0.019324510938040215, 0.01011515881320177]
[10]:
# marcus rate
def marcus_rate(delta_g, beta):
    lam = 2 * g**2 * omega
    return v**2 * np.sqrt(np.pi * beta / lam) * np.exp(-(beta * (lam + delta_g) ** 2) / (4 * lam))


# fit temperature
from scipy.optimize import curve_fit

beta = curve_fit(marcus_rate, delta_g_list, rate)[0][0]
from scipy.integrate import trapezoid


# nuclear tunneling rate
def nuclear_tunneling_rate(delta_g):
    s = g**2
    t = np.linspace(-6, 6, int(1e3))
    integrand = v**2 * np.exp(
        1j * delta_g * t - s * (1 - np.exp(1j * omega * t)) - s * (-1j * omega * t + omega**2 * t**2)
    )
    return trapezoid(integrand.real, t.ravel())


dense_delta_g = np.linspace(-3, 1)
plt.plot(
    dense_delta_g,
    np.log10([marcus_rate(delta_g, beta) for delta_g in dense_delta_g]),
    linestyle="-.",
    label="Marcus rate (fitted)",
)
plt.plot(
    dense_delta_g,
    np.log10([nuclear_tunneling_rate(delta_g) for delta_g in dense_delta_g]),
    linestyle="--",
    label="Full quantum rate",
)
plt.plot(delta_g_list, np.log10(rate), linestyle="", marker="o", markersize=6, label="Simulation")
plt.xlabel(r"$\Delta G$")
plt.ylabel("Transfer rate log$_{10} \ k$")
plt.legend(frameon=True)
[10]:
<matplotlib.legend.Legend at 0x7fe1a82b5c10>

[11]:
fig = plt.figure(figsize=(8, 3.5), tight_layout=True)
ax1, ax2 = fig.subplots(1, 2)

plt.sca(ax1)
for i, n in enumerate(n_list):
    label = r"$\Delta G =" + str(delta_g_list[i]) + "$"
    plt.plot(t, n.real[:, 0], label=label, linestyle="--")
plt.xlabel("$t$")
plt.ylabel(r"Occupation $\langle a^\dagger_0 a_0 \rangle$")
plt.text(-2.2, 1.02, r"$(\bf{a})$", fontsize="x-large")
plt.legend()

plt.sca(ax2)
plt.plot(
    dense_delta_g,
    np.log10([marcus_rate(delta_g, beta) for delta_g in dense_delta_g]),
    linestyle="-.",
    label="Marcus rate (fitted)",
)
plt.plot(
    dense_delta_g,
    np.log10([nuclear_tunneling_rate(delta_g) for delta_g in dense_delta_g]),
    linestyle="--",
    label="Full quantum rate",
)
plt.plot(delta_g_list, np.log10(rate), linestyle="", marker="o", markersize=6, label="Simulation rate")
plt.xlabel(r"$\Delta G$")
plt.ylabel("Transfer rate log$_{10} \ k$")
plt.text(-4.2, -1.43, r"$(\bf{b})$", fontsize="x-large")
plt.legend(frameon=True)
plt.savefig("marcus.pdf")
